After learning the basics of Power BI in Part 1, the next step is to improve your skills by working smarter with reports, visuals, and dashboard design. Basic Power BI is not only about creating charts. It is also about presenting data in a clear, useful, and professional way.
If you want to grow your confidence with Basic Power BI, this part will help you understand how to make better reports, avoid common mistakes, and practice like a real beginner analyst.
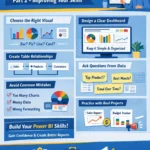
Step 7: Choose the Right Visual for the Right Data
One common beginner mistake is using too many visuals in one report. In Basic Power BI, it is better to keep your dashboard simple and easy to read.
Use visuals based on your data type:
- Bar chart for comparing categories
- Line chart for showing trends over time
- Pie chart for simple percentage breakdowns
- Card visual for key numbers like total sales or profit
- Table or matrix for detailed data
Choosing the right visual helps users understand your report faster. A clean dashboard often performs better than a crowded one.
Step 8: Make Your Dashboard Easy to Read
A good Power BI dashboard should look professional and organized. Try to keep similar visuals together and use clear titles such as:
- Total Monthly Sales
- Top 5 Products
- Region Performance
- Profit by Category
Use simple colors, enough white space, and readable fonts. Do not overload the page with too many charts. In Basic Power BI, a clean layout creates a better user experience and makes your dashboard more attractive.
Step 9: Use Basic Relationships Between Tables
As you continue learning Basic Power BI, you may start working with more than one table. For example, you might have:
- A sales table
- A product table
- A customer table
Power BI allows you to create relationships between these tables. This helps you build more powerful and accurate reports. Beginners should start by understanding simple one-to-many relationships and how tables connect through common columns like Product ID, Customer ID, or Date.
This step is very important because well-connected data creates better insights.
Step 10: Learn to Ask Questions From Data
Basic Power BI is not just about visuals. It is also about asking useful questions, such as:
- Which product sold the most?
- Which month had the highest profit?
- Which region is underperforming?
- What trend can be seen over time?
When you build reports with questions in mind, your dashboards become more valuable. This is how business owners, managers, and teams use Power BI for decision-making.
Step 11: Avoid Common Beginner Mistakes
Many new users make simple mistakes while learning Basic Power BI. Here are a few to avoid:
- Using messy or incomplete data
- Adding too many colors
- Creating too many visuals on one page
- Ignoring titles and labels
- Not checking number and date formatting
- Using complicated calculations too early
The best way to improve is to keep your reports simple at first. Once you understand the basics, you can slowly add advanced features.
Step 12: Practice With Small Real Projects
The fastest way to learn Basic Power BI is through practice. Start with small projects such as:
- Monthly sales dashboard
- Personal budget tracker
- Expense report
- Product performance report
- Employee attendance summary
These mini projects help you understand data import, chart design, slicers, and report layout. They also build your confidence step by step.
Step 13: Share and Review Your Work
After creating a dashboard, take time to review it. Ask yourself:
- Is the report clear?
- Are the numbers correct?
- Is the dashboard easy to read?
- Can someone understand it quickly?
You can also share your report with friends, coworkers, or clients for feedback. Improving through review is a smart way to grow your Basic Power BI skills.
Why Basic Power BI Is Worth Learning
Basic Power BI is a valuable skill for modern work and business. It helps you turn raw data into useful reports that support better decisions. Whether you want to improve your office skills, grow your freelance services, or prepare for a data-related job, Power BI gives you a strong advantage.
It is beginner-friendly, practical, and widely used in many industries such as sales, finance, HR, marketing, and operations.
Final Thoughts
Learning Basic Power BI does not have to be difficult. Start with small datasets, use simple visuals, practice dashboard design, and improve step by step. The more you practice, the easier it becomes to create professional reports and business dashboards.
Some tips for Your:
a) How Digital Marketing Tools Are Important for All Businesses
b) How to Find USA and UK Leads for Your Business
c) What Is a Digital Product and How It Helps People and Businesses