In today’s data-driven world, learning Basic Power BI is a smart step for anyone who wants to create professional reports, dashboards, and business insights. Whether you are a student, job seeker, freelancer, business owner, or office worker, Power BI can help you turn simple data into meaningful visual reports.
If you are new to Power BI, do not worry. You do not need to be a data expert to get started. With a little practice, you can learn the basics and begin building useful dashboards.
What Is Power BI?
Power BI is a business intelligence and data visualization tool developed by Microsoft. It helps users connect data from Excel, CSV files, databases, and other sources, then convert that data into charts, graphs, and interactive dashboards.
Many companies use Power BI to track sales, monitor performance, analyze trends, and make better decisions. That is why learning Basic Power BI can also improve your career opportunities.
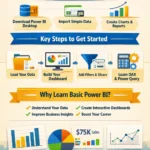
Step 1: Download Power BI Desktop
The first step is to download Power BI Desktop, which is available for free from Microsoft. This software allows beginners to create reports and practice with data without needing advanced tools.
After installation, open the program and explore the main layout. You will see sections for importing data, creating visuals, and managing reports.
Step 2: Start With Simple Data
The easiest way to begin is by using an Excel file or CSV file. For example, you can use sales data, monthly expenses, employee records, or product lists.
When you import data into Power BI, check whether the columns are clean and properly named. Make sure numbers, text, and dates are in the correct format. Clean data makes your reports better and easier to understand.
Step 3: Learn the Main Power BI Areas
To understand Basic Power BI, focus on these three important parts:
1. Data
This is where your information comes from. You import and review your dataset here.
2. Visuals
This is where you create charts, tables, KPIs, cards, and graphs.
3. Reports
This is the final dashboard page where you organize your visuals in a professional way.
These three areas are the foundation of Power BI for beginners.
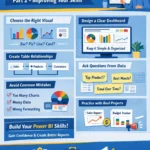
Step 4: Build Your First Dashboard
Once your data is loaded, start with simple visuals like:
- Bar chart
- Pie chart
- Table
- Card
- Line chart
For example, if you have sales data, you can create a report showing total sales, top products, monthly growth, and region performance. This helps you understand how Power BI turns raw data into clear business insights.
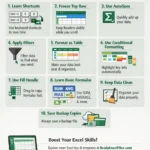
Step 5: Practice Filters and Slicers
One of the best features of Power BI is interactivity. You can add filters and slicers so users can select a month, category, region, or product and instantly see updated results.
This makes dashboards more useful and professional.
Step 6: Learn Power Query and Basic DAX Slowly
As a beginner, you should also start learning Power Query and simple DAX formulas. Power Query helps clean and shape data, while DAX helps create calculations such as totals, averages, and percentages.
You do not need to learn advanced formulas in the beginning. Start with simple steps and improve over time.
Why Learn Basic Power BI?
Learning Basic Power BI can help you:
- Understand data more clearly
- Create professional dashboards
- Improve business reporting
- Save time in analysis
- Build a valuable job skill
Today, many employers look for people who can work with data and reporting tools. That is why Power BI is becoming an important skill in many industries.
Get high-quality Power BI dashboard templates
A) 150+ Power BI Dashboard Templates for Business
B) 80+ Power BI Dashboard Templates
C) 3500+ Editable Professional Excel Templates – Ready Business & Office