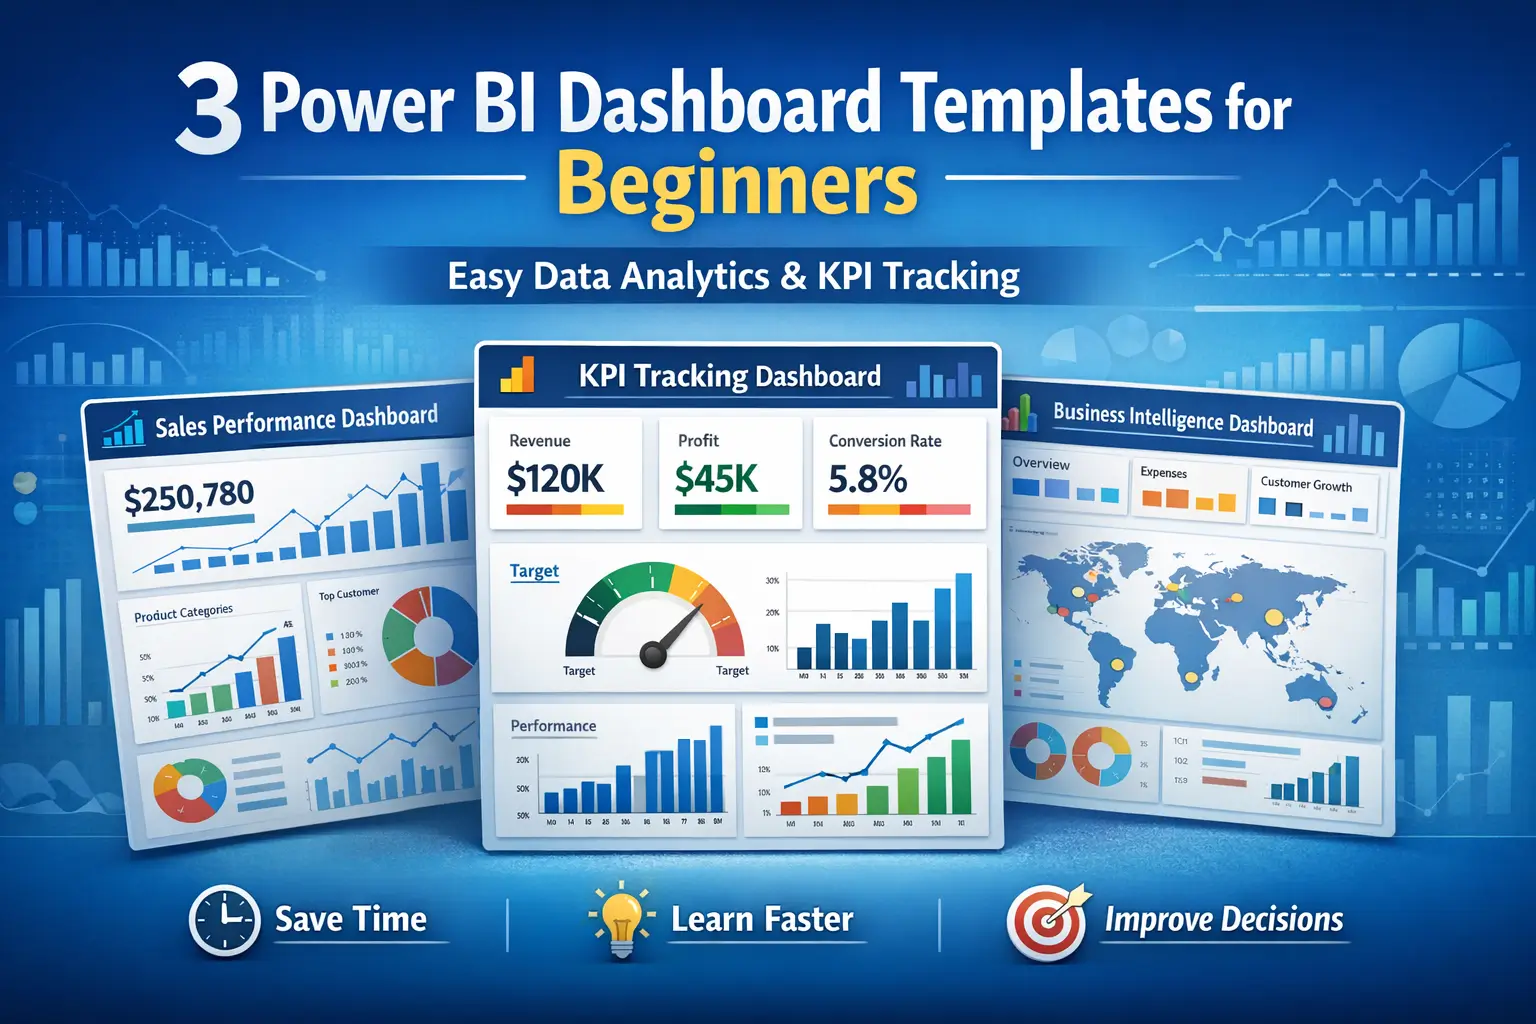
Power BI is one of the best tools for turning raw business data into clear, professional, and interactive reports. Many beginners want to use Power BI, but they often feel confused when starting from scratch. That is why ready-made Power BI dashboard templates for data analytics, KPI tracking, and business intelligence are so useful. They help save time, reduce design work, and make reporting much easier.
In this beginner-friendly tutorial, you will learn how to use 3 Power BI dashboard templates in a simple way. These examples are easy to understand and useful for business owners, marketers, sales teams, analysts, and freelancers who want better reporting without spending hours building dashboards manually.
Why Power BI Dashboard Templates Are Helpful
Power BI dashboard templates are ready-to-use report layouts that help you organize data faster. Instead of creating every chart, KPI card, and filter from zero, you can start with a professional template and customize it for your own needs.
These templates are helpful because they:
Save time
Look professional
Make reporting easier
Help beginners learn faster
Improve business decision-making
Turn complex data into simple visual reports
If you are a beginner, starting with templates is one of the smartest ways to learn Power BI.
1. Sales Performance Dashboard Template Tutorial
A Sales Performance Dashboard Template is one of the most useful Power BI dashboards for beginners. It helps track revenue, monthly sales, products, top customers, and sales growth in one place.
What this dashboard usually includes
Total sales amount
Monthly or yearly sales trends
Top-selling products
Best-performing regions
Customer purchase performance
Sales target vs actual results
Easy tutorial for beginners
First, open your sales data in Excel or CSV format. Then import that file into Power BI. After that, connect the data fields like sales amount, date, product name, and region to the dashboard template.
Next, refresh the visuals and check whether the numbers match your file. You can then change filters, date ranges, and chart labels to fit your business.
For example, if you run an online shop, this dashboard can quickly show which products are selling more and which month gives the best revenue.
Why beginners should use it
This template is easy because sales data is simple to understand. It also teaches you how Power BI uses charts, cards, and filters together in one report.
2. KPI Tracking Dashboard Template Tutorial
A KPI Tracking Dashboard Template is perfect for people who want to measure business performance clearly. KPI means Key Performance Indicator. These are the numbers that tell you if your business is moving in the right direction.
What this dashboard usually includes
Revenue KPI
Profit KPI
Conversion rate
Customer growth
Project completion rate
Performance target vs result
Easy tutorial for beginners
Start by preparing a simple spreadsheet with your KPI data. For example, you can create columns for target value, actual value, month, and department. After importing the file into Power BI, connect those fields to your KPI dashboard template.
Then, use cards and charts to compare targets against actual results. You can add color indicators to quickly see if the result is good, average, or below target.
For example, if your monthly sales target is $10,000 and actual sales are $8,500, the dashboard can show the gap clearly. This makes business planning much easier.
Why beginners should use it
This template helps beginners understand how to monitor goals in a visual way. It is simple, practical, and useful for almost every business type.
3. Business Intelligence Overview Dashboard Template Tutorial
A Business Intelligence Dashboard Template gives a complete overview of important business data in one screen. It is useful for managers, business owners, and teams who want a quick summary of operations, finance, sales, and trends.
What this dashboard usually includes
Overall business summary
Revenue and expense charts
Growth trends
Customer insights
Regional performance
Business comparison metrics
Easy tutorial for beginners
First, collect your main business data in one organized file. This can include sales, expenses, customers, and performance numbers. Import that data into Power BI and load the template.
Now map the columns correctly so the charts can read the data. Once the dashboard is connected, you can customize titles, brand colors, and report sections. You can also add slicers so users can filter by month, product, or region.
For example, a small business owner can use this dashboard to see revenue, costs, and customer performance in one place without opening multiple reports.
Why beginners should use it
This template gives a full business picture. It is great for learning how multiple report elements work together in Power BI.
Tips for Beginners Using Power BI Dashboard Templates
If you are new to Power BI, keep these simple tips in mind:
Keep your data clean
Make sure your Excel or CSV data is well organized. Use clear column names and remove duplicate or empty rows.
Start with simple files
Do not begin with very large or confusing data. Start with small reports and learn step by step.
Check data types
Make sure dates, numbers, and text fields are in the correct format before importing.
Use ready-made templates
Templates save time and help you learn dashboard design faster.
Practice customization
Change titles, colors, charts, and filters so you understand how each section works.
Who Should Use These Power BI Dashboard Templates
These templates are perfect for:
Small business owners
Beginners learning Power BI
Sales managers
Marketing teams
Accountants
Freelancers
Data analysts
Startup teams
Project managers
If you want quick reporting and better business insights, these templates can help you start fast.
Why People Buy Ready-Made Power BI Templates
Many people buy ready-made templates because building a professional dashboard from zero takes time. A beginner may spend days trying to design one clean report. With ready-made templates, the work becomes faster, easier, and more professional.
People buy them because they:
Save hours of report design time
Get instant business reporting solutions
Learn faster through real examples
Improve presentation quality
Use dashboards for clients, business, or internal reporting
Avoid technical confusion in the beginning
This is why Power BI Dashboard Templates for Data Analytics, KPI Tracking, and Business Intelligence are becoming very popular.